
Why infographics?
Infographics are an increasingly popular way of sharing information in newspapers, magazines, and online. Infographics are a wonderful tool for analyzing and communicating information. They are a combination of graphics and data designed to make complex ideas and large amounts of data easy to understand. There are many ways to create infographics. After exploring a variety of examples, you will create your own infographic poster that will help others better understand an issue or concept you are studying.
Watch and answer the worksheet
The Beauty of Data Visualization
You can find the worksheet in the Campus Share Drive: Infographics Questions. They've been printed for you as well.
Examples
Though infographics are informational, they don't always have to be about something in the news.
Research and Plan
The process begins not with making the infographic, but with research. You'll spend a couple of class periods researching your topic as well as you will visually convey it. Infographics always include citations. Make sure you capture citations as you research.
As you take notes, you should produce a sketch of you you want to share the information. Organization and design are critical.
As you plan out design, ask yourself:
- Which information, facts, and data are essential to include? Which aren’t?
- What colors and layout works best in sharing the information?
- What graphs and graphics best convey information and data to the viewer?
- What is the order, or flow, of information?
The point of an infographic is to transfer knowledge and information quickly. The final poster should be informative, simple, engaging, and design-friendly.
Use the Infographic Planning Chart to help you plan out the information. You can find it in the Campus Share Drive.
Design
Before you start your infographic in Illustrator, watch this short video that demonstrates how to use the graph/chart tools.
Note: You can import spreadsheets or type your information into the pop-up grid.
Requirements:
- 8.5 x 14 inch, Illustrator file saved as #_lastname_infographic
- A main title/heading
- Eye catching section headings
- A well thought out color scheme (3-5 colors, not including black and white)
- Well thought out font choices (2-4 fonts)
- Design elements - alignment, contrast, proximity, repetition, white space
- Minimum of one graph/chart
- Minimum of 5 graphics (keep them similar - all clipart, all photos, all illustrated, etc.
- Minimum of 10 facts to compare/contrast
- non-fiction text analyzing and summarizing the information
- Three blocks of information, GRAMMAR COUNTS
- Your name in the lower right corner
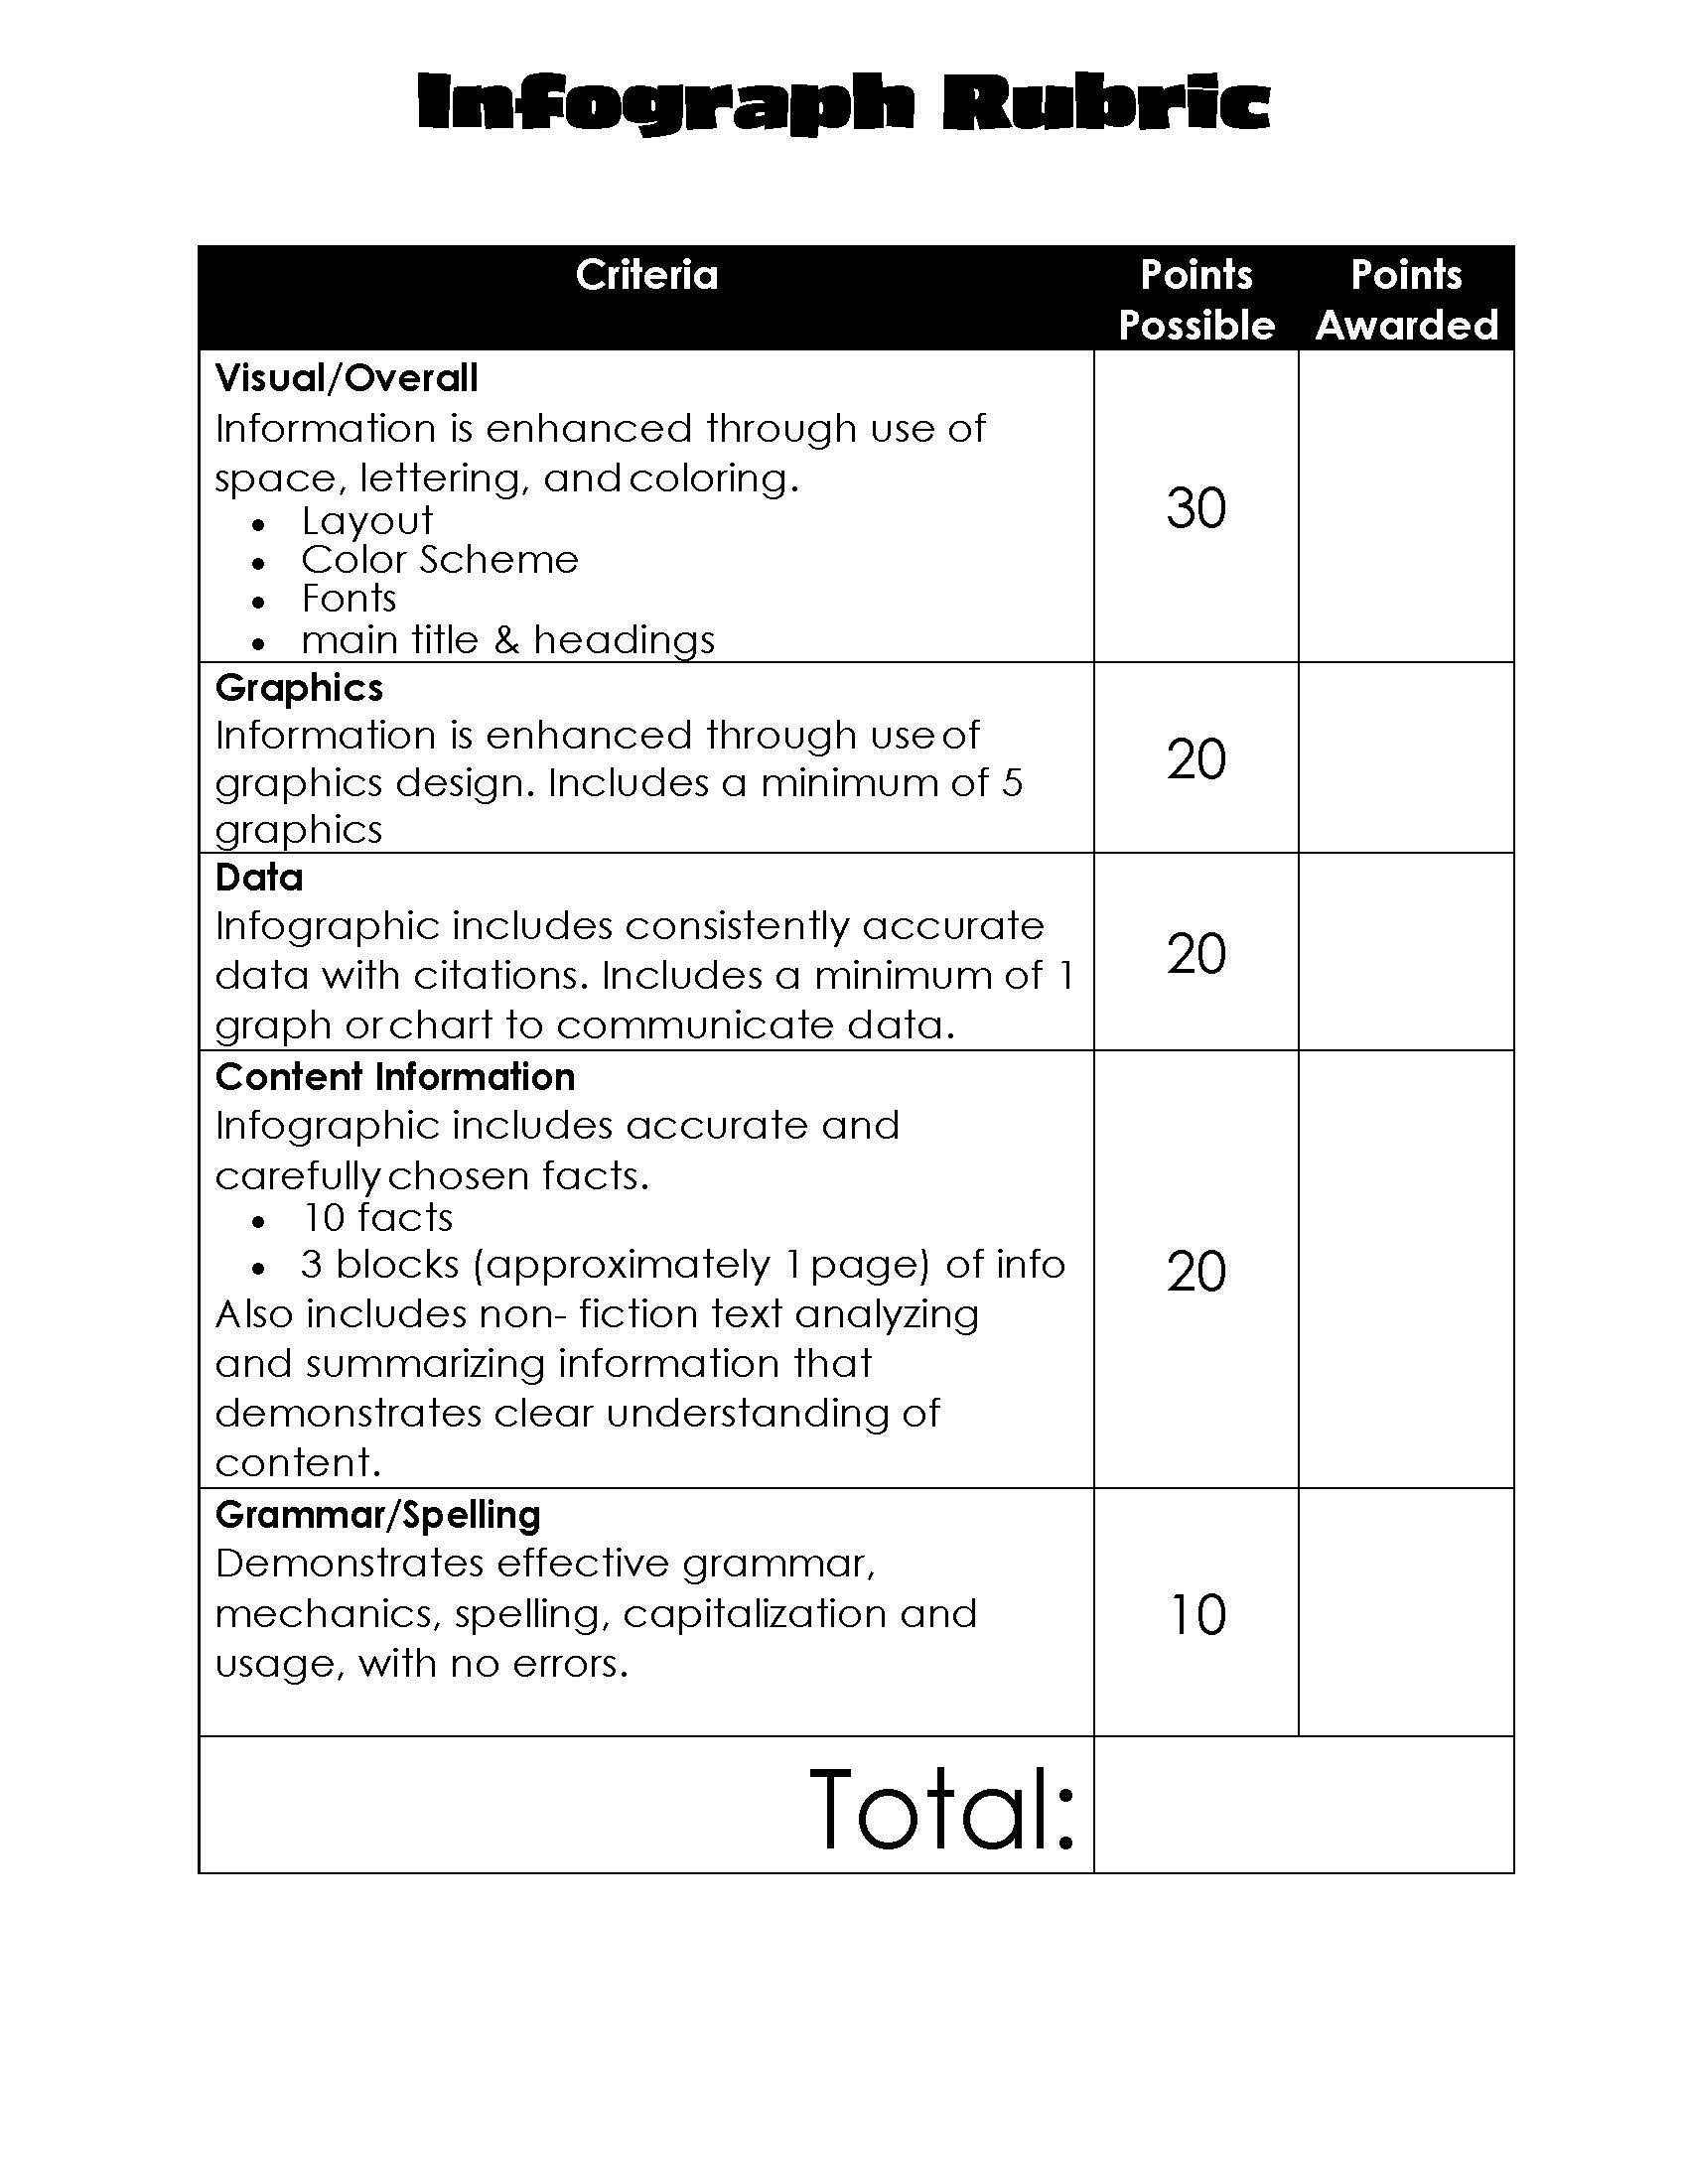
Rubric on how you'll be graded
When you finish, save your file and export it as a PNG
Turning it in...
You'll put your post on your current six weeks ePortfolio page. Newest posts go at the top.
- Title of the challenge/assignment
- Reflective questions
- Why did you choose the topic you did?
- What was the most interesting piece of information you found?
- Ask a neighbor to look at it and give you one piece of feedback to change - what is that feedback?
- Embed the image below the questions.